
The short answer.
Base demand on actual attendance and participation assumptions.
Keep quiet, typical and busy scenarios visibly separate.
Record peak demand and operating effort alongside daily drinks.
Start with attendance, not headcount
An office with one hundred employees does not necessarily have one hundred daily coffee users. Build your worksheet around people actually present. Separate employees, contractors and visitors, and distinguish regular office days from company events. Ask the workplace team for attendance ranges rather than a single annual average that hides the busiest day.
Create columns for quiet, typical and busy conditions. For each, enter expected attendance and the share likely to use the coffee station. Treat these as assumptions until a survey or observation supports them. A visible assumption is easier to improve than a confident looking number with no explanation.
Translate participation into drinks
Use a simple planning calculation: people present multiplied by the participating share multiplied by drinks per participating person. Add visitor and event drinks separately so they remain visible. For illustration, forty people, a participating share of one half and two drinks each imply forty employee drinks. Ten visitor drinks bring that hypothetical day to fifty.
That calculation estimates demand; it does not establish that a particular machine is suitable. Record the source and date beside every input. If survey answers suggest three drinks but observed use is closer to one, carry both scenarios until the difference is understood.

Add the workload the cup total misses
List the proportions of black coffee, espresso, milk drinks and hot water. Note cup sizes and whether users often select an extra shot. Add the busiest fifteen minute interval and any fixed meeting breaks. A station serving longer milk drinks needs to be tested with those recipes instead of a convenient demonstration menu.
Next list the supporting work: water refills, bean refills, grounds removal, cup restocking and scheduled care. Put an owner beside each task. A promising equipment choice becomes less attractive if the required attention conflicts with the staffing available at that location.
Apply model evidence carefully
Use professional equipment recommendations and the exact supplier configuration when forming a shortlist. JURA identifies the W8 model 15650 as a professional machine with a recommended maximum daily output of fifty. This is a screening reference, not a promise that any fifty drink office will have an acceptable queue.
Keep a worksheet field for manufacturer daily guidance, another for demonstrated peak performance and another for unresolved questions. Request written clarification of intended use, service arrangements and accessory compatibility. Do not treat a household machine with an appealing menu as an equivalent workplace option without explicit suitability confirmation.
Turn the worksheet into a trial brief
Give prospective suppliers the same three attendance scenarios and the same menu mix. Ask them to run your busy sequence, describe refill access and identify the supporting equipment included in the quote. Compare results against the service experience you want employees and visitors to have.
After installation, replace assumptions with actual counts over the first month. Check whether demand shifted because better coffee attracted new users. Keep the worksheet as a living record of attendance, drink patterns and operating effort. It should help you adjust replenishment and service arrangements as the office changes, rather than remain a purchasing document that nobody opens again.
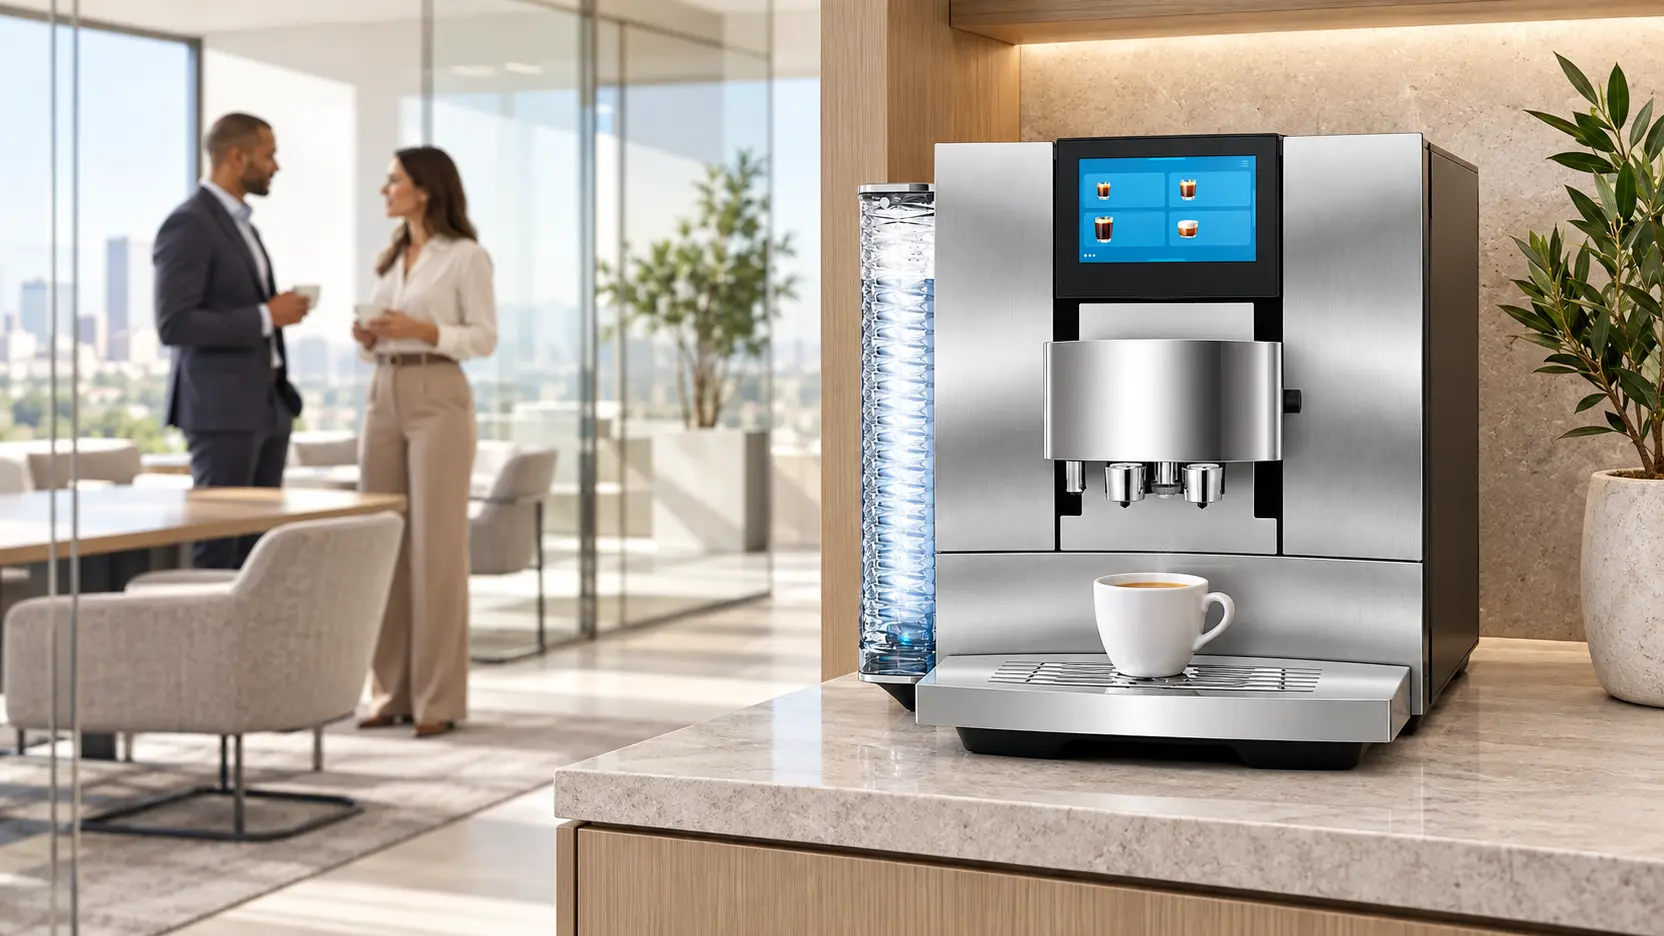
Use three scenarios instead of one precise-looking total
Create a quiet, typical and busy row using the same calculation structure. For illustration, thirty attendees with half participating and two drinks each gives thirty employee drinks; sixty attendees under the same assumptions gives sixty. Add visitor demand in its own column. Those numbers describe hypothetical consumption, not the suitability of a particular model. Keeping the structure constant makes it obvious whether a changed forecast comes from attendance, participation or individual consumption.
Add an evidence column beside each input. Attendance might come from a facilities estimate, participation from a short staff survey, and drinks per user from a week of observation. Give every assumption a review date. When the figures disagree, investigate the behavior behind them: people may currently leave the office for coffee, avoid a poor station, or drink more during collaborative days. A new station can change participation, so buying solely to reproduce an inconvenient old service may understate demand.
Finish with a decision row containing the proposed commercial configuration, unresolved peak questions and the person responsible for closing each gap. Keep the equipment price outside the demand calculation so a favored price does not quietly change the workload assumptions. After a trial, update the worksheet with actual refill frequency, closing effort and queue observations. These operating details often help distinguish two otherwise plausible choices more clearly than another round of speculative cup estimates.
Useful answers, before you decide.
Should I multiply total employee headcount by a fixed number?
That can be a rough starting scenario, but it hides attendance and participation differences. Use people actually present where possible, identify the share using the station and add visitors separately so the assumptions remain editable.
What if the office is growing?
Add a clearly dated future scenario with its expected attendance and service pattern. Ask suppliers to explain options for that future workload without treating uncertain growth as an observed current requirement.
Research notes and sources
These references informed this guide. Manufacturer instructions and final purchase terms take precedence.
- JURA W8 US specifications
 Workplace · 5 min
 Workplace · 5 min
 Workplace · 5 min